


Progress Towards Poverty Reduction
Examine global and regional/continental progress towards poverty reduction, including the growth of the “new global middle class”
Progress Towards Poverty Reduction
Examine global and regional/continental progress towards poverty reduction, including the growth of the “new global middle class”
Explore the data below

Click to open
DEFINING POVERTY
TASK 1: Read the text and note a selection of data to illustrate the global situation
Poverty entails more than the lack of income and productive resources to ensure sustainable livelihoods. Its manifestations include hunger and malnutrition, limited access to education and other basic services, social discrimination and exclusion, as well as the lack of participation in decision-making.
In 2015, more than 736 million people lived below the international poverty line.
Around 10 per cent of the world population (pre-pandemic) was living in extreme poverty and struggling to fulfil the most basic needs like health, education, and access to water and sanitation, to name a few.
There were 122 women aged 25 to 34 living in poverty for every 100 men of the same age group, and more than 160 million children were at risk of continuing to live in extreme poverty by 2030.
Most people in the world live in poverty.
85% of the world live on less than $30 per day, two-thirds live on less than $10 per day, and every tenth person lives on less than $1.90 per day.
According to the most recent estimates, in 2015, 10 percent of the world’s population or 734 million people lived on less than $1.90 a day.
Southern Asia and sub-Saharan Africa are expected to see the largest increases in extreme poverty, with an additional 32 million and 26 million people, respectively, living below the international poverty line as a result of the pandemic.
The share of the world’s workers living in extreme poverty fell by half over the last decade: from 14.3 per cent in 2010 to 7.1 per cent in 2019.
Even before COVID-19, baseline projections suggested that 6 per cent of the global population would still be living in extreme poverty in 2030, missing the target of ending poverty. The fallout from the pandemic threatens to push over 70 million people into extreme poverty.
One out of five children live in extreme poverty, and the negative effects of poverty and deprivation in the early years have ramifications that can last a lifetime.
In 2016, 55 per cent of the world’s population – about 4 billion people – did not benefit from any form of social protection.
In each of these statistics price differences between countries are taken into account to adjust for the purchasing power in each country (Source).
TASK 2: Watch the video below and note 5 facts, explaining how they are related to poverty reduction.
POVERTY AT THE GLOBAL SCALE
The Millenium Development Goals (MDGs) helped to reduce global extreme poverty by 50% between 1990 and 2015.
However, for the first time in a generation, the quest to end poverty has suffered its worst setback. This setback is largely due to major challenges — COVID 19, conflict, and climate change — facing all countries, but in particular those with large poor populations.
The increase in extreme poverty from 2019 to 2020 is projected to be larger than any time since the World Bank started tracking poverty globally in a consistent manner. While COVID-19 is a new obstacle, conflicts and climate change have been increasing extreme poverty for years in parts of the world.


PROGRESS IN POVERTY AT THE REGIONAL AND NATIONAL SCALE
TASK 3: Study the graph below. Describe the changes in extreme poverty by world region. Include data in your answer.
TASK 4: Watch the video below which outlines progress made towards poverty reduction in different parts of the world and at different scales. Describe and explain the progress made in poverty reduction in different regions of the world.
THE GLOBAL MIDDLE CLASS
Trends in global wealth distribution seen since the beginning of the century:
The global middle class, with wealth in the range of USD 10,000–100,000, has seen the biggest rise in numbers this century, after more than trebling in size from 504 million in 2000 to 1.8 billion in mid-2021.
This reflects the growing prosperity of emerging economies, especially China, and the expansion of the middle class in the developing world.

CASE STUDY: ECONOMIC GROWTH IN VIETNAM
EXAM PRACTICE
Explain why the growth of the global middle class may lead to increased water consumption. (2 marks)
Explain why the growth of the global middle class may lead to changes in diet (2 marks)
Measuring Resource Consumption
Measuring trends in resource consumption, including individual, national and global ecological footprints
Measuring Resource Consumption
Measuring trends in resource consumption, including individual, national and global ecological footprints
TASK 1 - DEFINE ECOLOGICAL FOOTPRINT
The Ecological Footprint is a measure of how much area of biologically productive land and water an individual, population or activity requires to:
produce all the resources it consumes and
to absorb the waste it generates,
The Ecological Footprint is usually measured in global hectares (gha).
TASK 2 - Calculate your Ecological Footprint

TASK 3 - OUTLINE REGIONAL TRENDS
Watch the video and explore the data. Examine how the ecological footprint varies by country and region. Write a summary into your notes.
TASK 4 - COMPARE INDIVIDUAL, NATIONAL & GLOBAL TRENDS
Choose 2 countries at different levels of economic development. Explore the trends in how ecological footprint has changed over time at the individual, national and global level. Suggesrt reasons for the differences.

TASK 5 - EXAM PRACTICE
Water: Patterns & Trends
Describe and explain global patterns and trends in the availability and consumption of water, including embedded water in food and manufactured goods
Water: Patterns & Trends
Describe and explain global patterns and trends in the availability and consumption of water, including embedded water in food and manufactured goods
TASK 1 - Watch the video and note the different types of water and how water is used in different economic contexts
TASK 2 - Study the infographic below and describe the global pattern of water availability related to population.
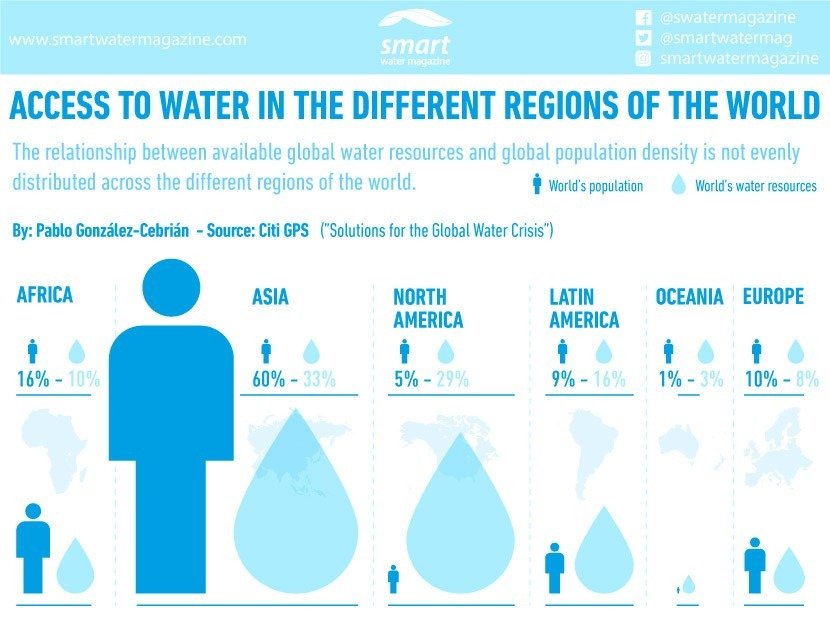
Water scarcity is the lack of sufficient available water resources to meet the demands of water usage within a region. It already affects every continent and around 2.8 billion people around the world at least one month out of every year. More than 1.2 billion people lack access to clean drinking water.
Water scarcity involves water stress, water shortage or deficits, and water crisis.
While the concept of water stress is relatively new, it is the difficulty of obtaining sources of fresh water for use during a period of time and may result in further depletion and deterioration of available water resources. Water shortages may be caused by climate change, such as altered weather patterns including droughts or floods, increased pollution, and increased human demand and overuse of water. A water crisis is a situation where the available potable, unpolluted water within a region is less than that region's demand.
Water scarcity is being driven by two converging phenomena: growing freshwater use and depletion of usable freshwater resources.
Water scarcity can be a result of two mechanisms: physical (absolute) water scarcity and economic water scarcity, where physical water scarcity is a result of inadequate natural water resources to supply a region's demand, and economic water scarcity is a result of poor management of the sufficient available water resources.
According to the United Nations Development Programme, the latter is found more often to be the cause of countries or regions experiencing water scarcity, as most countries or regions have enough water to meet household, industrial, agricultural, and environmental needs, but lack the means to provide it in an accessible manner.
TASK 3 - Watch the video and define physical and economic water scarcity
TASK 4 - Describe the global pattern of physical and economic water scarcity

Compare and contrast physical and economic water scarcity
Describe the global pattern of economic water scarcity
Why is there no physical or economic water scarcity in central Sahara desert? (refer to the definition)
TASK 5 - Water embedded in food and industrial goods (virtual water)
Virtual water is the water embodied in the production of food and fiber and non-food commodities, including energy.

Land & Food: Patterns & Trends
Examine global patterns and trends in the availability and consumption of land and food
Land & Food: Patterns & Trends
Examine global patterns and trends in the availability and consumption of land and food
AVAILABILITY & CONSUMPTION OF LAND FOR AGRICULTURE
TASK 1: Describe global land use for agriculture referring to data from the graph

TASK 2: Describe the distribution of areas with less land available for farming (green).
CONSUMPTION OF FOOD: PATTERNS AND TRENDS
TASK 3: With reference to data, describe global changes in daily supply of calories between 1961 & 2018.
CONSUMPTION OF MEAT & ECONOMIC DEVELOPMENT
TASK 4: Describe the relationship shown on the graph.
CHANGING DIETS IN MIDDLE INCOME COUNTRIES
Energy: Patterns & Trends
Global patterns and trends in the availability and consumption of energy, including the relative and changing importance of hydrocarbons, nuclear power, renewables, new sources of modern energy
Energy: Patterns & Trends
Global patterns and trends in the availability and consumption of energy, including the relative and changing importance of hydrocarbons, nuclear power, renewables, new sources of modern energy
Name the world’s top ten oil producers
What is OPEC and what is its main purpose?
What is fracking and how has it transformed the USAs energy supply?
Compare and contrast the strategies used by the USA and China for their future energy supplies.
Explain three challenges the world faces in transitioning to cleaner sources of energy.
PEAK OIL & ALTERNATIVE SOURCES OF ENERGY
Watch the first 17 minutes and take detailed notes on the history of oil extraction, peak oil and the advantages and disadvantages of different forms of energy.
ENERGY CONSUMPTION PATTERNS
Describe the global pattern of areas with high (> 50,000 kWh) energy use per person (2 marks)
Answer: North America (1) Oceania (1) Middle East inc Saudi Arabia, UAE (1)
OIL
Examine the map below and write a summary describing the availability (size) and consumption (colour) of oil at the global scale.

NUCLEAR
RENEWABLE SOURCES OF ENERGY
Outline the advantages and disadvantages of different sources of renewable energy