



Global Energy Production and Consumption
Examine global trends in energy production and consumption
Global Energy Production and Consumption
Examine global trends in energy production and consumption
INTRODUCTION
Global sources of energy remain dominated by fossil fuels - in 2020, 84.3% of global energy came from fossil fuels.
This has not changed much in recent years, despite progress made with renewable energy. Even countries such as Switzerland continue to obtain a large proportion of their energy sources from fossil fuels.
TASK 1: GLOBAL ENERGY DEMAND
Watch the video and note the main issues.
TASK 2: GLOBAL ENERGY PRODUCTION
Describe and explain how global energy sources changed between 1938 and 2019.
TASK 3: MAPPING GLOBAL ENERGY PRODUCTION
Watch the video
Annotate a world map to show the global distribution of energy production
TASK 4: DESCRIBING GLOBAL PATTERNS AND TRENDS OF PRODUCTION AND CONSUMPTION
Download a copy of the writing frame on the right (File > Download)
Study each of the graphs below and take a screenshot
Import the screenshot into the table in the worksheet
For each graphic, describe the general and specific patterns and trends, referring to data in your answers.
GLOBAL ENERGY CONSUMPTION BY REGION
With reference to data from the graph, describe trends in energy consumption by region.
GLOBAL ENERGY CONSUMPTION BY SOURCE
With reference to data from the graph, describe the trends in global energy consumption by source.
ENERGY CONSUMPTION BY SOURCE FOR SELECTED COUNTRIES
With reference to data from the graph, compare and contrast the sources of energy consumption for the countries shown.
PER CAPITA OIL CONSUMPTION FOR SELECTED COUNTRIES
With reference to data from the graph, compare and contrast per capita oil consumption for the countries shown.
GLOBAL RENEWABLE ENERGY PRODUCTION
With reference to data from the graph, describe global trends in renewable energy production.
ENERGY FROM RENEWABLE SOURCES
With reference to data from the graph, describe the global pattern of share of primary energy from renewable sources.
NUCLEAR ENERGY
With reference to named countries, describe the global pattern of energy production by nuclear.

Energy Types
Evaluate the role of renewable and non-renewable forms of energy in global energy production
Energy Types
Evaluate the role of renewable and non-renewable forms of energy in global energy production

Energy Supply Case Study
Examine the issues of energy supply in Switzerland
Energy Supply Case Study
Examine the issues of energy supply in Switzerland
TASK 1 : ENERGY FACTS AND FIGURES
TASK 2 : ENERGY SOURCES IN SWITZERLAND
Explore the map above
On a blank map of Switzerland, indicate the regions producing:
Hydroelectricity (dams)
Nuclear energy
Wind energy
Create a key to explain your use of symbols and add a title to your map
TASK 3 : SWISS ENERGY POLICY
Access the link
Write a summary of Switzerland’s energy policy focusing on the main priorities for the future
TASK 4 : NUCLEAR ENERGY IN SWITZERLAND
Switzerland needs to find a replacement for electricity production from nuclear power. Watch the video above and answer the following questions:
Describe 2 problems relating to the extra electricity required following closure of nuclear plants
What are the difficulties facing Switzerland when importing energy from France and Germany?
Why might the importation of energy be a benefit to Switzerland?
ALTERNATIVE SOURCES OF ENERGY TO REPLACE NUCLEAR
Watch the video and describe two ways in which new technologies can help to replace the energy lost from nuclear power in Switzerland.
TASK 5 : ALTERNATIVE ENERGY DECISION MAKING EXERCISE
Switzerland has decided to close all of its nuclear power plants by 2050. A big challenge will be how to replace the one third of electricity currently generated by nuclear with alternative options.
Propose a plan to replace nuclear with alternative energy sources. These energy solutions should aim to reduce CO2, in accordance with Swiss Energy Policy.
Open the map in the Swisstopo website. You can turn layers on and off using the “Maps Displayed” tab on the left.
Using screenshots of map information, propose and justify 3 locations for the development of:
Geothermal (Map layer = Heat Flux 500)
Biogas (Map layer = Non-woody biomass for energy)
Solar (Map layer = Sunshine duration 1991-2020)
Wind (Map layer = Areas with wind power potential)
Water (Map layer = Water power potential)

Raw Materials & Minerals
Raw Materials & Minerals
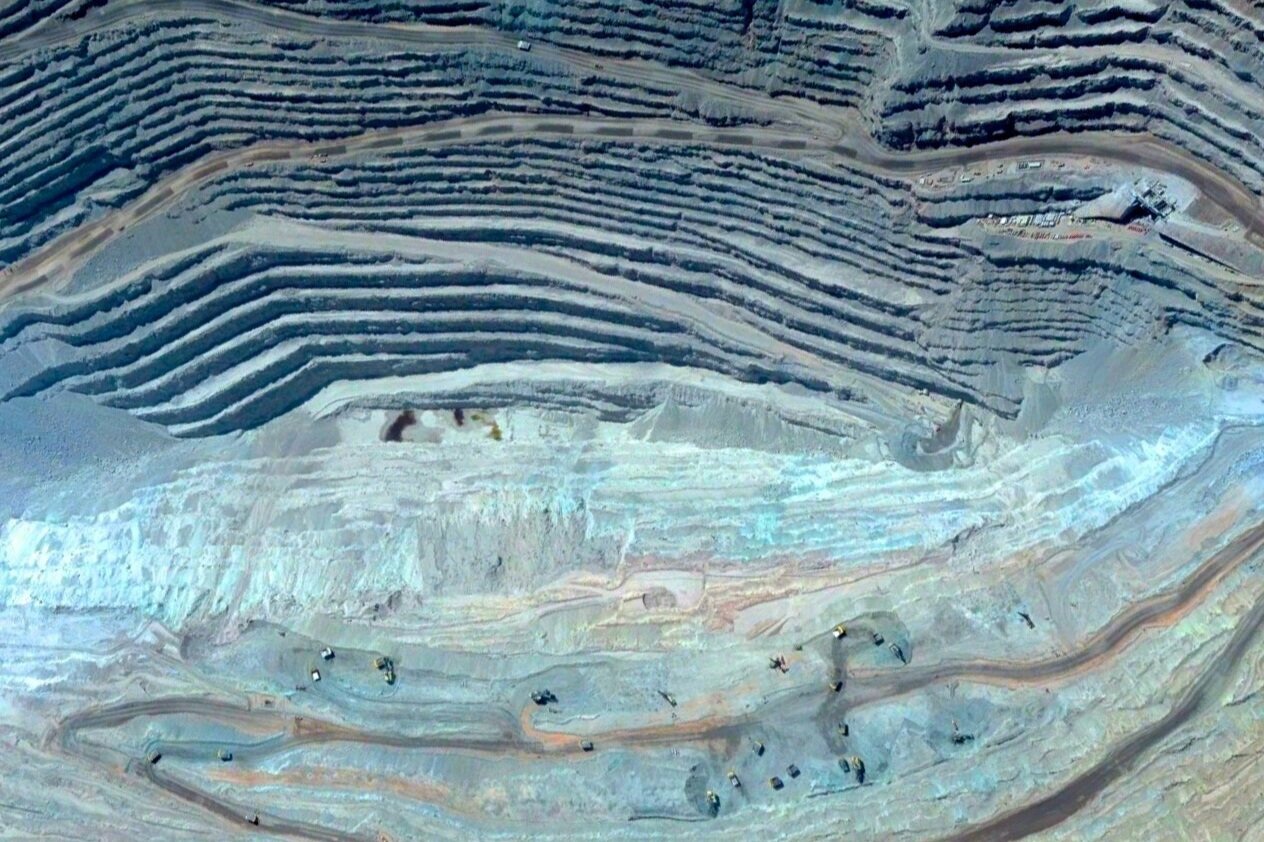
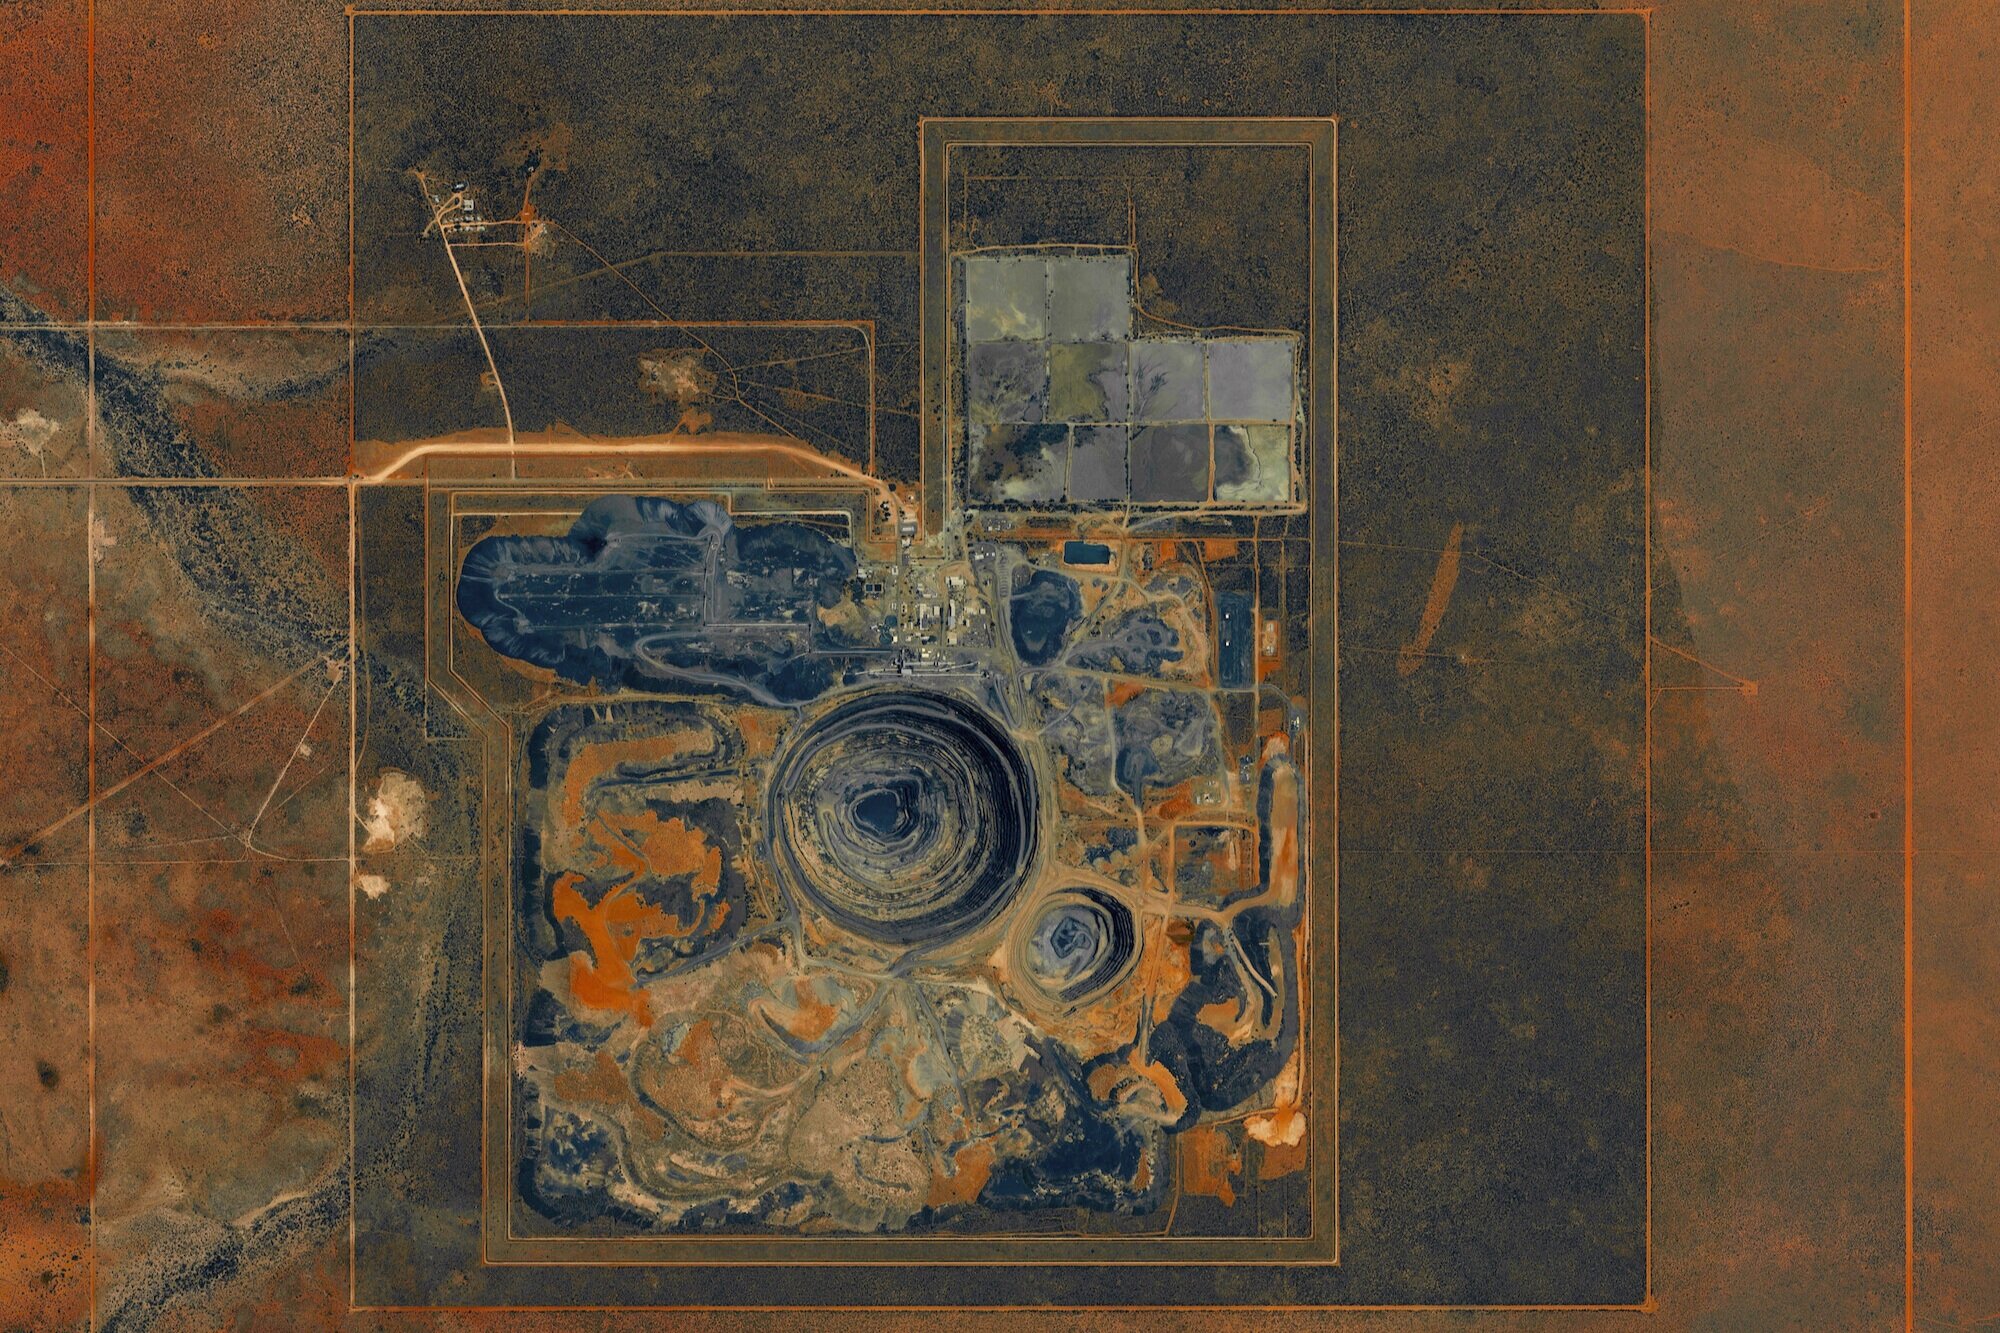
TASK ONE: MINERAL DISTRIBUTION IN SWITZERLAND
Examine the map below and describe the distribution of mineral resources in Switzerland.
Open the map in Swiss Topo by clicking on the icon top left
On a blank map of Switzerland, indicate the main regions for the production of different minerals
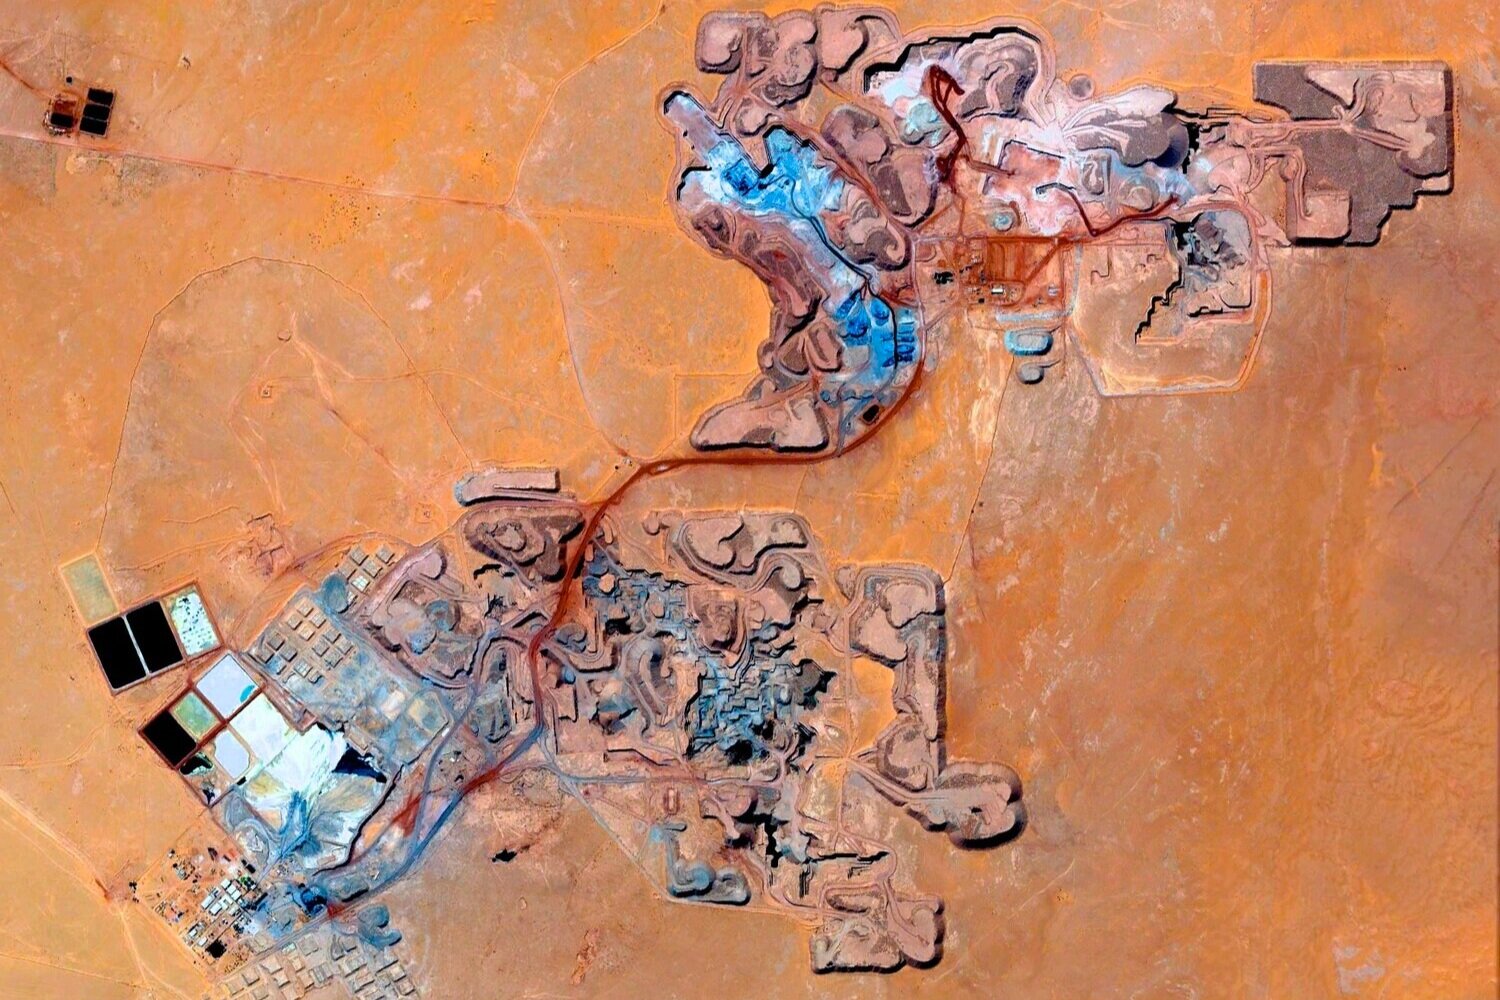
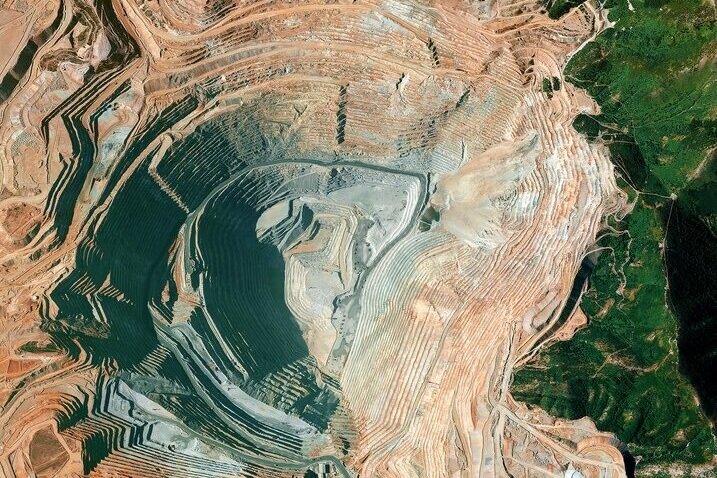
TASK TWO: GLOBAL DISTRIBUTION OF MINERALS
On a blank world map, add symbols to show the distribution of:
Aluminium
Copper
Gold
Uranium
Write a paragraph describing the distribution of each resource. (Use continent and country names, regions, compass words and data in your description)
Explain 3 consequences of the distribution of these resources
TASK THREE: MINERAL WEALTH AND ECONOMIC DEVELOPMENT
Explain how diamonds contributed to economic development in Botswana.
TASK FOUR: CHALLENGES FOR GLOBAL MINERAL EXTRACTION
Watch the documentary. Describe the social, economic and environmental impacts of gold mining.


